Example to Open, Slice and Plot Anomaly and Climatology Maps
Configuration
[2]:
import numpy as np  # Used later
from spy4cast import Dataset

dataset_folder = "./datasets"  # Path to the folder where the datasets are stored.
dataset_filename = "HadISST_sst_chopped.nc"  # File format must be netcdf4.
ds = Dataset(dataset_filename, folder=dataset_folder)
# A chunks keyword argument can be provided in this step. This value will be
# stored internally and passed to in the opening step to use dask chunks.
[3]:
ds.open("sst") # Opens the dataset, stores variables.
[3]:
<spy4cast.dataset.Dataset at 0x7fa16000eca0>
[4]:
from spy4cast import Region, Month

region = Region(
    lat0=-30, latf=30,
    lon0=-60, lonf=15,
    month0=Month.MAY, monthf=Month.JUL,
    year0=1976, yearf=2000
)  # months can also be stated through integers.
ds.slice(region)  # year0 and yearf apply to monthf.
# ds.slice(region, skip=1)  # skip 1 data point in lat and lon dimension.
[4]:
<spy4cast.dataset.Dataset at 0x7fa16000eca0>
[6]:
from spy4cast.meteo import Clim, Anom

# Climatology maps and time series.
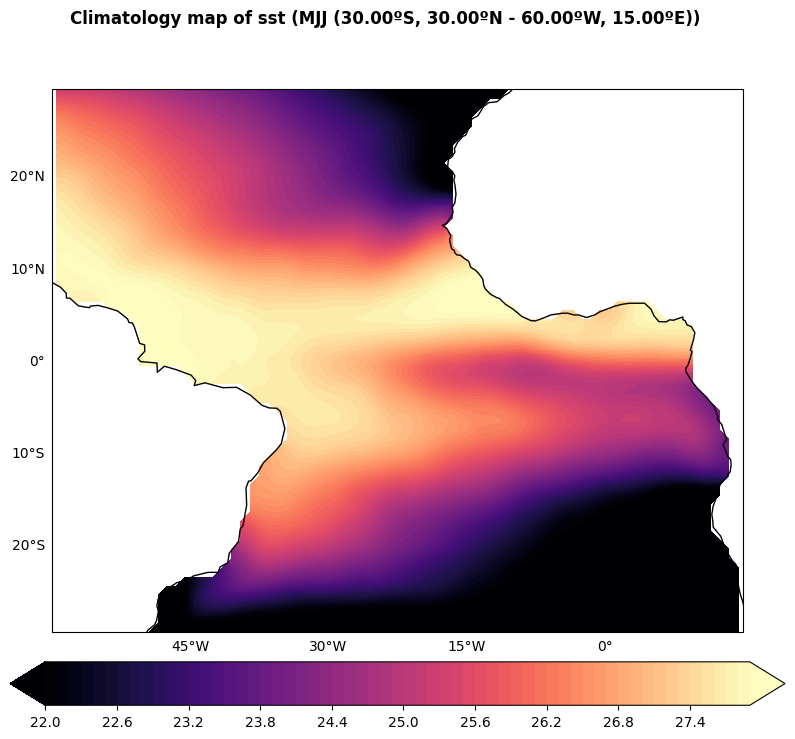
clim_map = Clim(ds, "map")  # Mean in the time dimension.
clim_ts = Clim(ds, "ts")  # Mean in the lat and lon dimension.
# Anomaly maps and time series
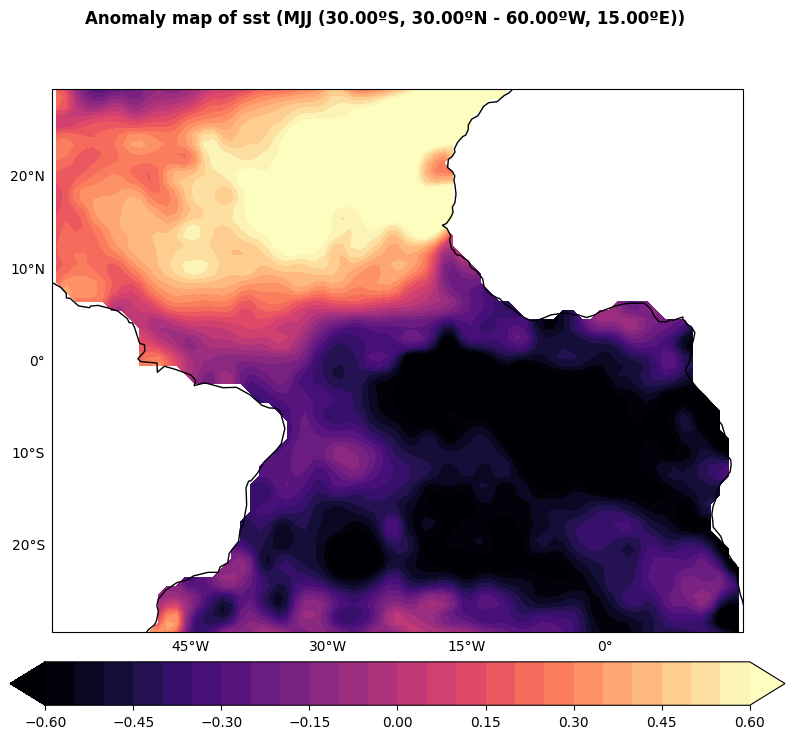
anom_map = Anom(ds, "map")  # An anomaly map for each year
anom_ts = Anom(ds, "ts")  # Mean in the lat and lon dimension
# Plot with the .plot method (look at docs). Example:
clim_map.plot(
    show_plot=True, save_fig=True,
    cmap="magma",
    name="plots-Climatology_Anomaly_EquatorialAtlantic/clim_map.png",
    levels=np.arange(22, 28, 0.1),
    ticks=np.arange(22, 28.5, 0.5),
)
anom_map.plot(
    year=1997, show_plot=True, save_fig=True,
    cmap="magma",
    name="plots-Climatology_Anomaly_EquatorialAtlantic/anom_map.png",
    levels=np.arange(-0.6, 0.6 + 0.05, 0.05),
    ticks=np.arange(-0.6, 0.8, 0.2),
)
# Save the data with the .save method (look at docs). Example:
anom_map.save("anom_map_", folder="./data-Climatology_Anomaly_EquatorialAtlantic/")
# Load previously saved data with the .load method (look at docs). Example:
anom_map = Anom.load("anom_map_", folder="./data-Climatology_Anomaly_EquatorialAtlantic/", type="map")
[INFO] Saving plot with path ./plots-Climatology_Anomaly_EquatorialAtlantic/clim_map.png
[INFO] Saving plot with path ./plots-Climatology_Anomaly_EquatorialAtlantic/anom_map.png
[INFO] Saving Anom data in `./data-Climatology_Anomaly_EquatorialAtlantic/anom_map_*.npy`
[INFO] Loading Anom data from `./data-Climatology_Anomaly_EquatorialAtlantic/anom_map_*` took 0.003 seconds
[ ]: