Plotting
To plot the results you have two main ways to do it:
Fast plots
These fast plots are meant for debugging and to see the results right away. They are not heavily tested and can break sometimes. We recommend using your own plotting functions instead of them.
Every methodology owns a .plot() function that takes in several arguments (check out the tutorial) to make a fast plot.
Own plots
Every user is encouraged to use their own plotting functions with this 3 steps:
Note
Check out the variables to learn which variables are inside each methodology.
Note
Check out the tutorial to learn how to save and load data.
# import the necessary libraries
from spy4cast.spy4cast import Preprocess, Crossvalidation

import matplotlib.pyplot as plt
import numpy as np
import cartopy.crs as ccrs
# Load the previously saved results
y = Preprocess.load('y_', dir='saved_data')
z = Preprocess.load('z_', dir='saved_data')
cross = Crossvalidation.load('mca_', dir='saved_data', dsy=y, dsz=z)
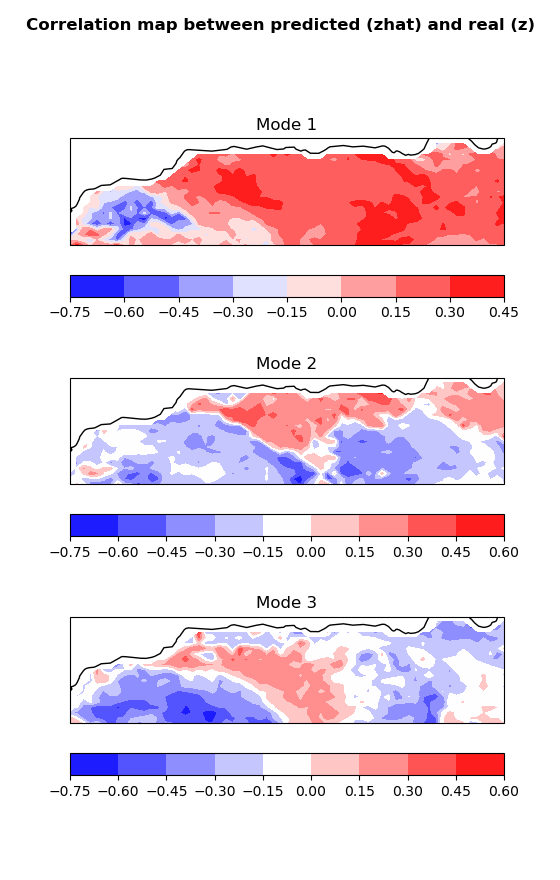
# Create figure of the correlation maps between z and zhat for the different modes

fig = plt.figure(figsize=(15, 8))

nm = cross.r_z_zhat_s_separated_modes.shape[0]
nzlat = z.lat.shape[0]
nzlon = z.lon.shape[0]
for i in range(nm):
    r_z_zhat = cross.r_z_zhat_s_separated_modes[i, :].reshape((nzlat, nzlon))
    ax = fig.add_subplot(3, 1, i+1, projection=ccrs.PlateCarree())
    im = ax.contourf(z.lon, z.lat, r_z_zhat, cmap='bwr')
    ax.coastlines()
    ax.set_title(f'Mode {i+1}')
    fig.colorbar(im, ax=ax, orientation='horizontal')
fig.suptitle('Correlation map between predicted (zhat) and real (z)', fontweight='bold')
plt.show()